ChartTraceBot – Smart Crypto Alerts via Telegram
Track fractal sweeps, Fair Value Gaps, Support/Resistance zones, and Rejection Blocks with real-time notifications and cross-timeframe validation.

Scan to start
Real-Time Event Detection
Detect Fractal Sweeps, FVG, SnR zones, and Rejection Blocks as they form on Binance markets.
Cross-Timeframe Validation
Optional X→X-1 liquidity validation ensures high-quality signals backed by lower-timeframe confirmation.
Unlimited Triggers
Create as many triggers as you need. Free plan: up to 10 pairs. Pro plan: up to 200 pairs.
How It Works
Add to Telegram
Click 'Start Bot' or scan the QR code to open ChartTraceBot in Telegram.
Create Triggers
Select trading pairs, event types (Fractal, FVG, SnR, RB), and timeframes (5m–1d). Choose whether to enable validation.
Receive Alerts
Get instant notifications with charts and event details directly in Telegram.
Tracked Event Types
ChartTraceBot monitors four key technical event types across multiple timeframes.
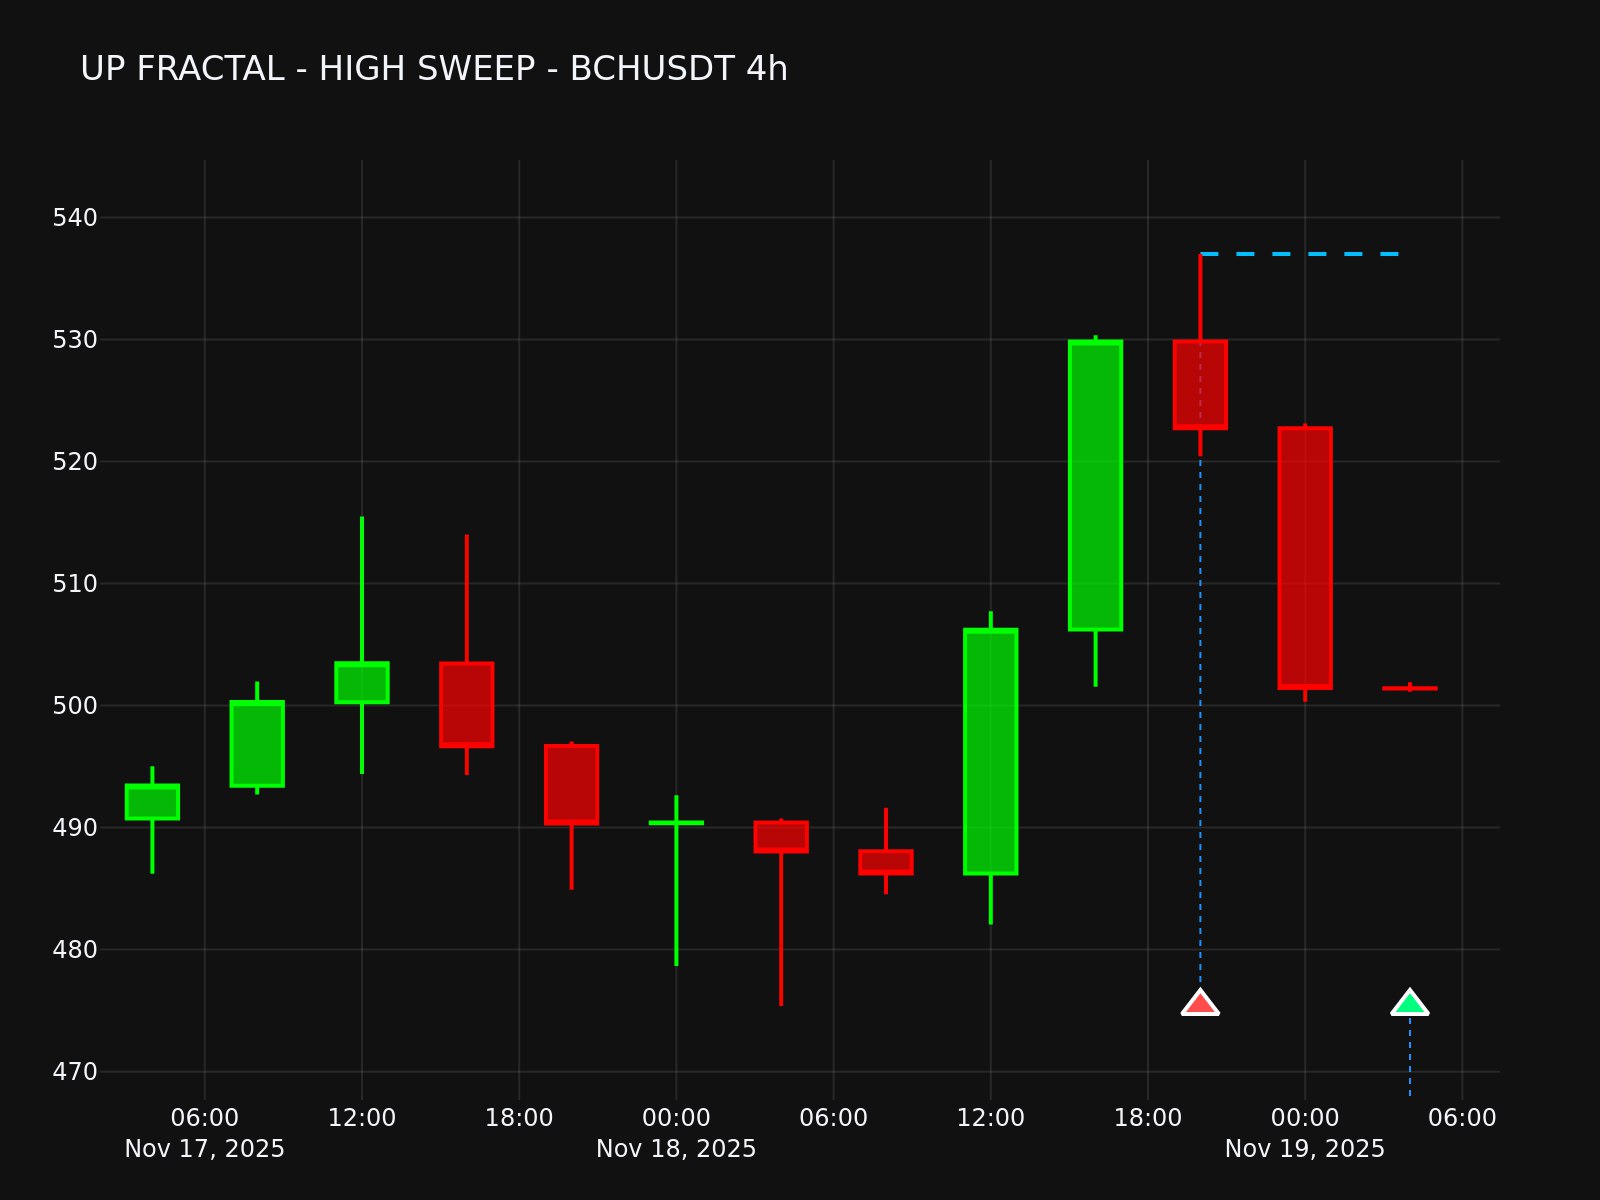
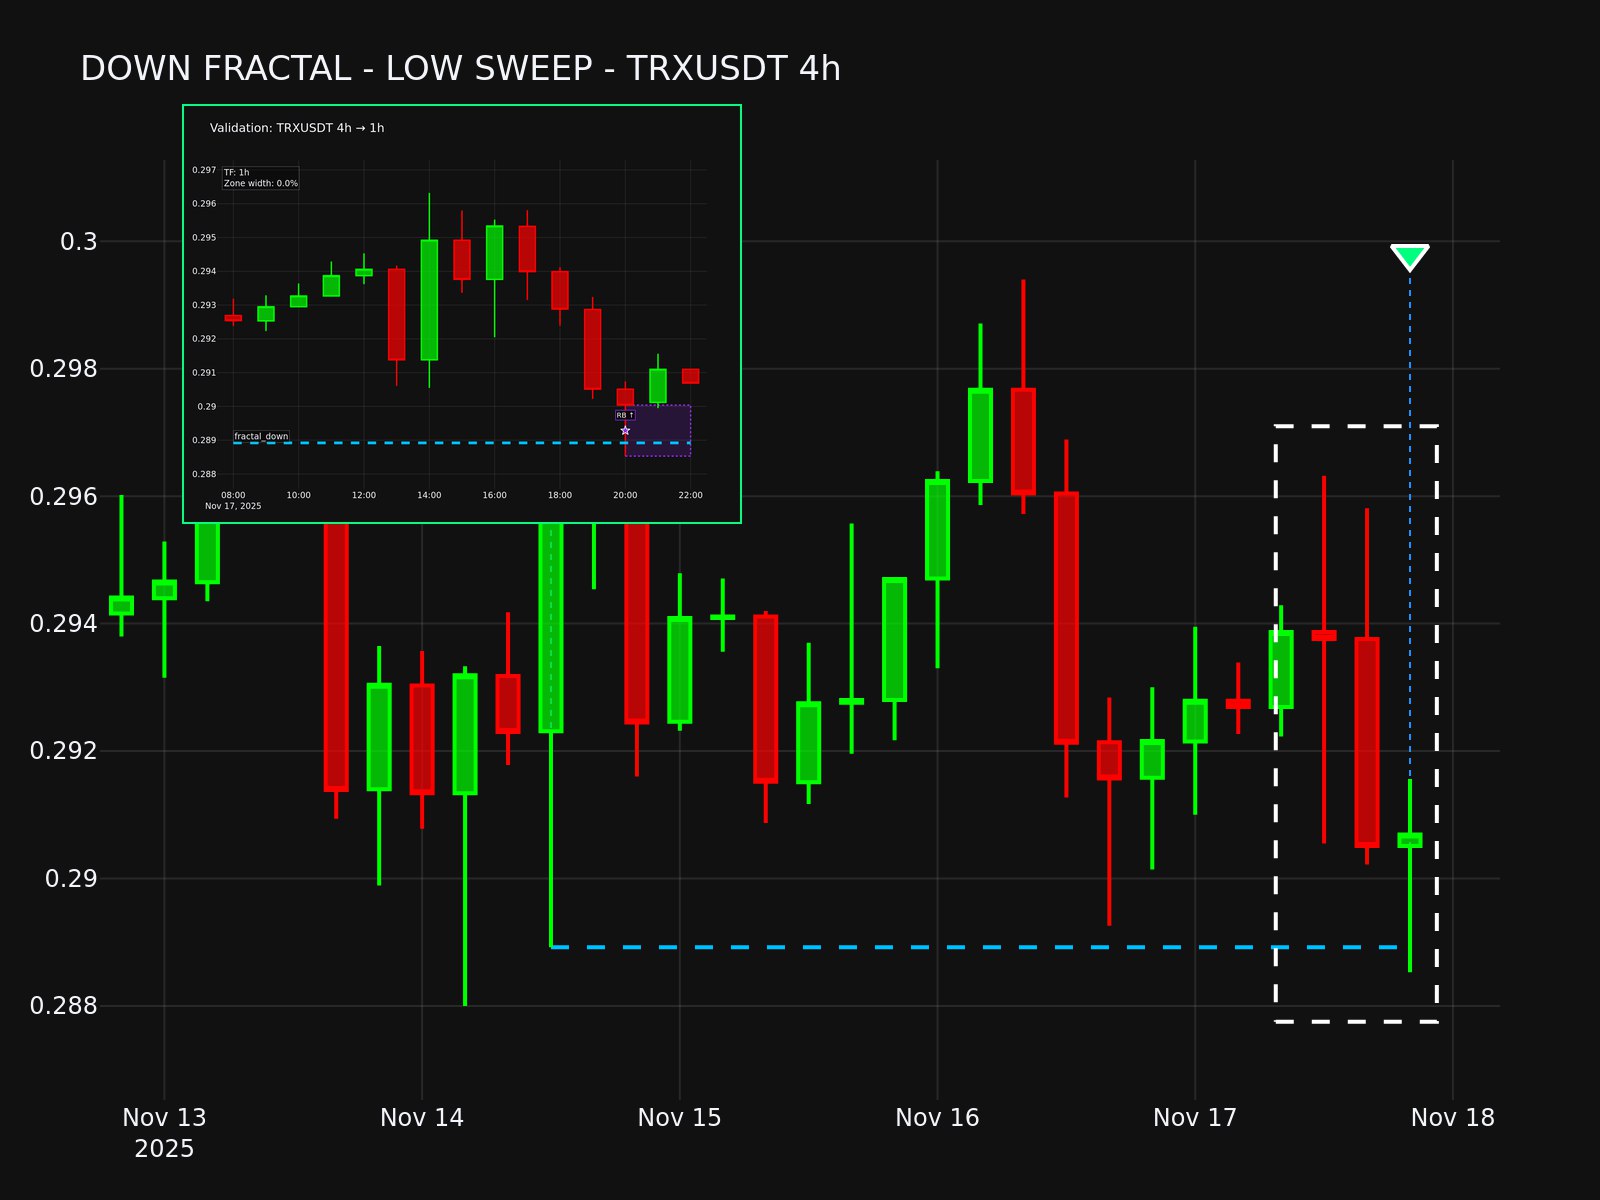
Fractal Liquidity Sweeps
Fractals identify local highs and lows formed by 3-candle patterns. A sweep occurs when price pierces (or exactly touches) the fractal level.
Detection Rules
- Up Fractal: Middle candle's low < left and right candles' lows.
- Down Fractal: Middle candle's high > left and right candles' highs.
Trigger Conditions
- Current candle's low goes below the up-fractal level (or touches it).
- Current candle's high goes above the down-fractal level (or touches it).
Use Case: Identify liquidity grabs and potential reversal zones.
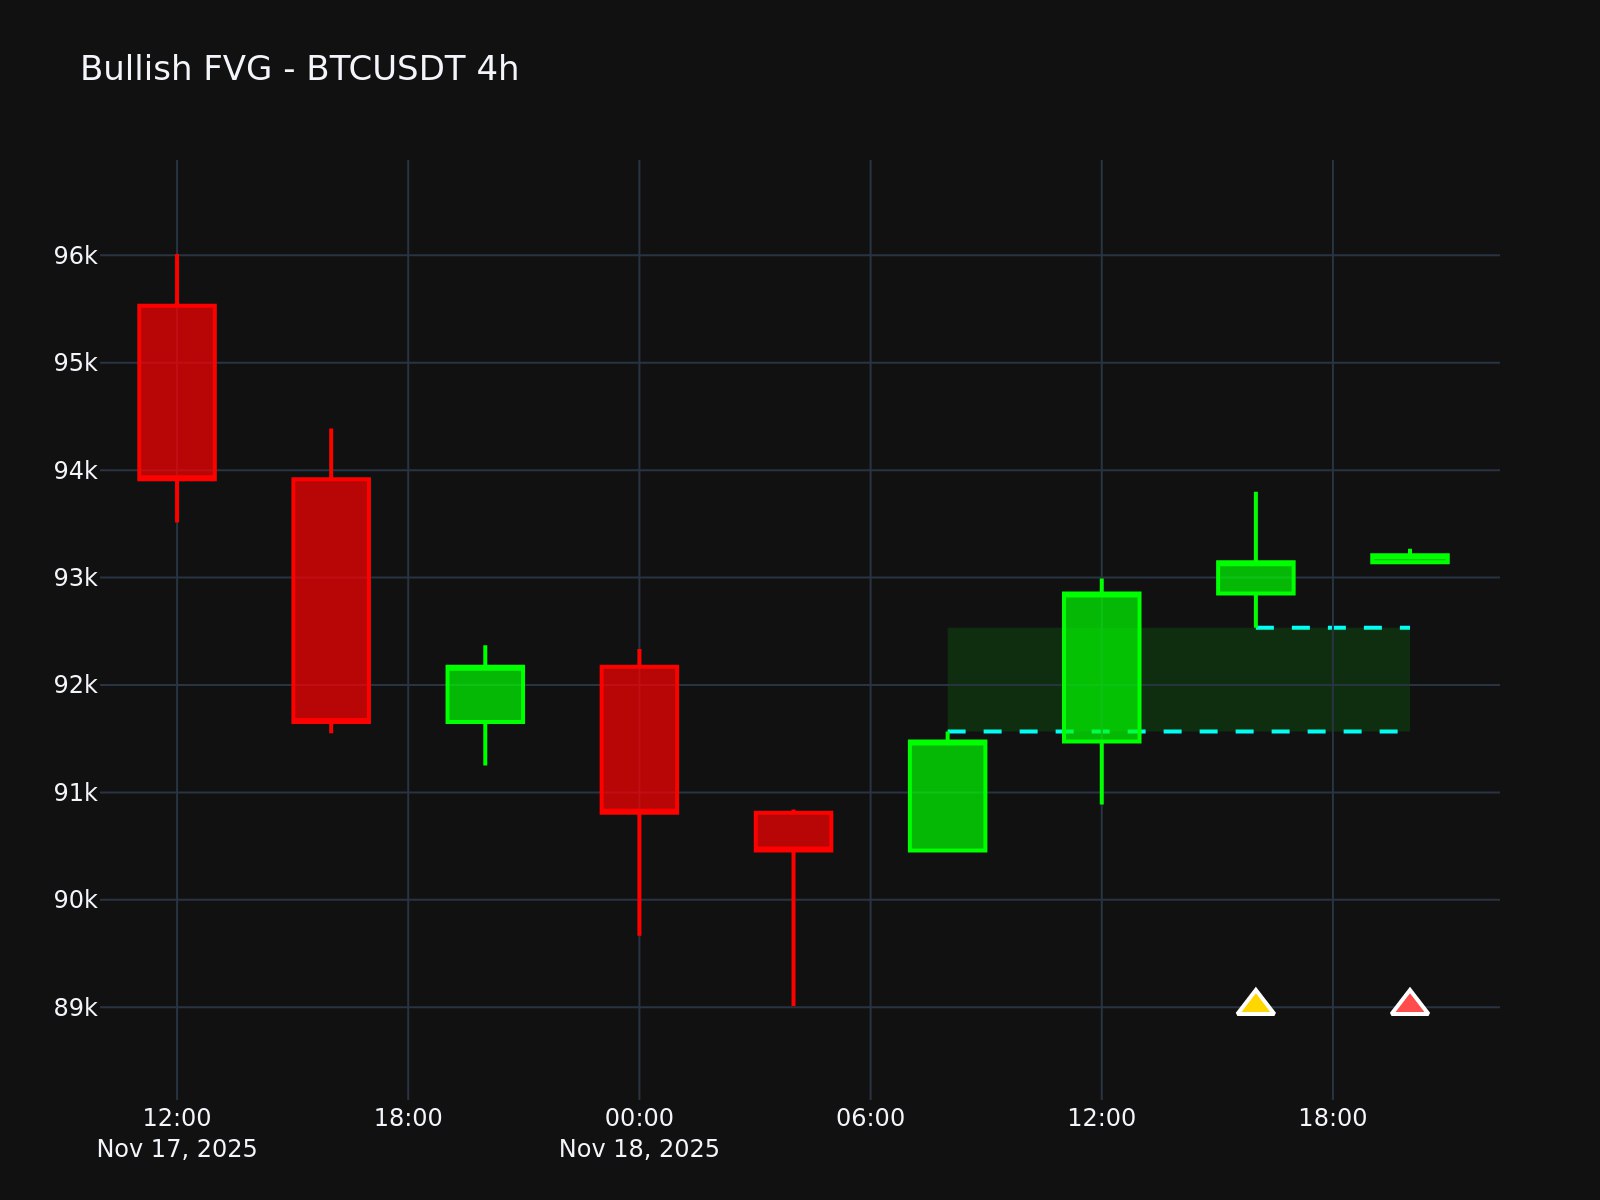
Fair Value Gaps (FVG)
FVG are price imbalances between consecutive candles, indicating areas where price may return to 'fill the gap.'
Detection Rules
- Bullish FVG: Right candle's low > Left candle's high.
- Bearish FVG: Right candle's high < Left candle's low.
Lifecycle States
- UNTESTED: Gap exists but price hasn't revisited it.
- TESTED: Price has entered the gap zone.
- EXITED: Price closed outside the gap after testing.
- COVERED: Gap is fully invalidated.
Use Case: Anticipate support/resistance rejections and continuation moves.
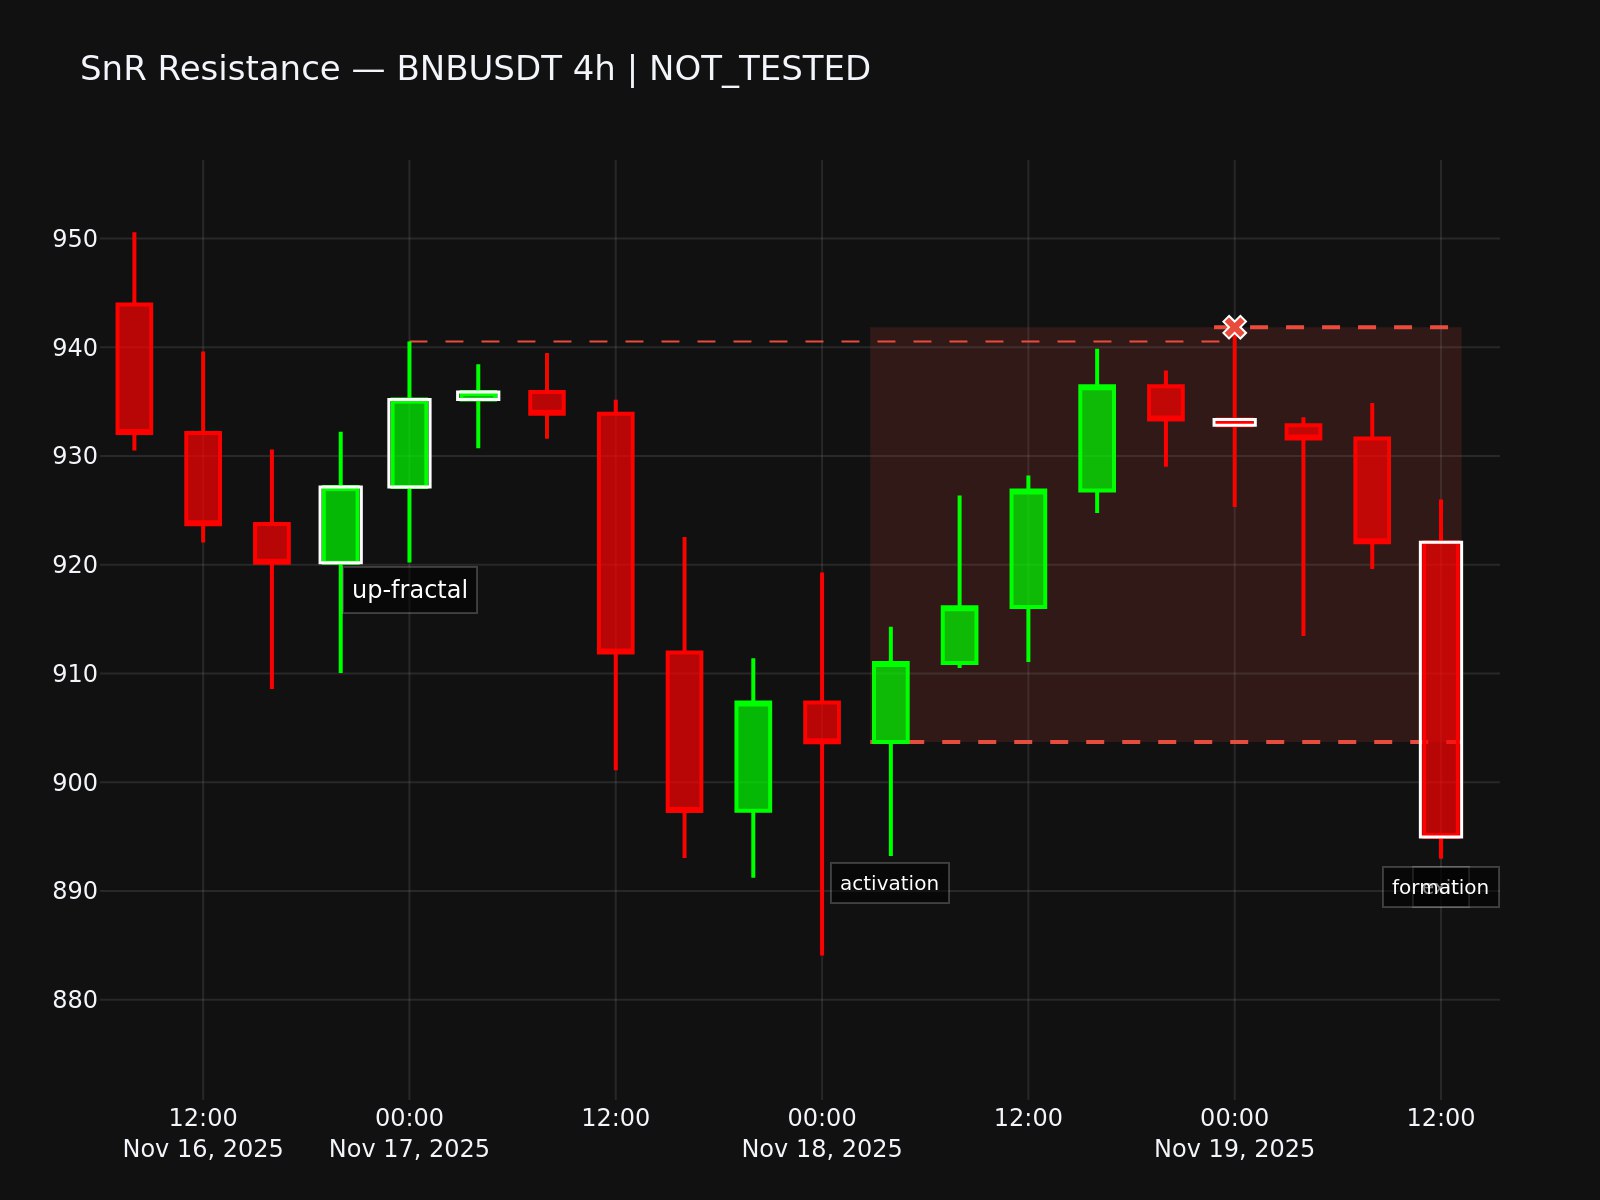
Support & Resistance (SnR) Zones
SnR zones are derived from confirmed fractals and FVG tests, marking key price levels where reversals occur.
Formation Sources
- Fractals: Up-fractal → Support; Down-fractal → Resistance.
- FVG: Bullish FVG test → Support; Bearish FVG test → Resistance.
Activation
Zone is validated when price breaks out from it and a trend reversal (color flip in the preceding 10 candles) is detected.
Use Case: Identify strong support/resistance levels for entries and exits.
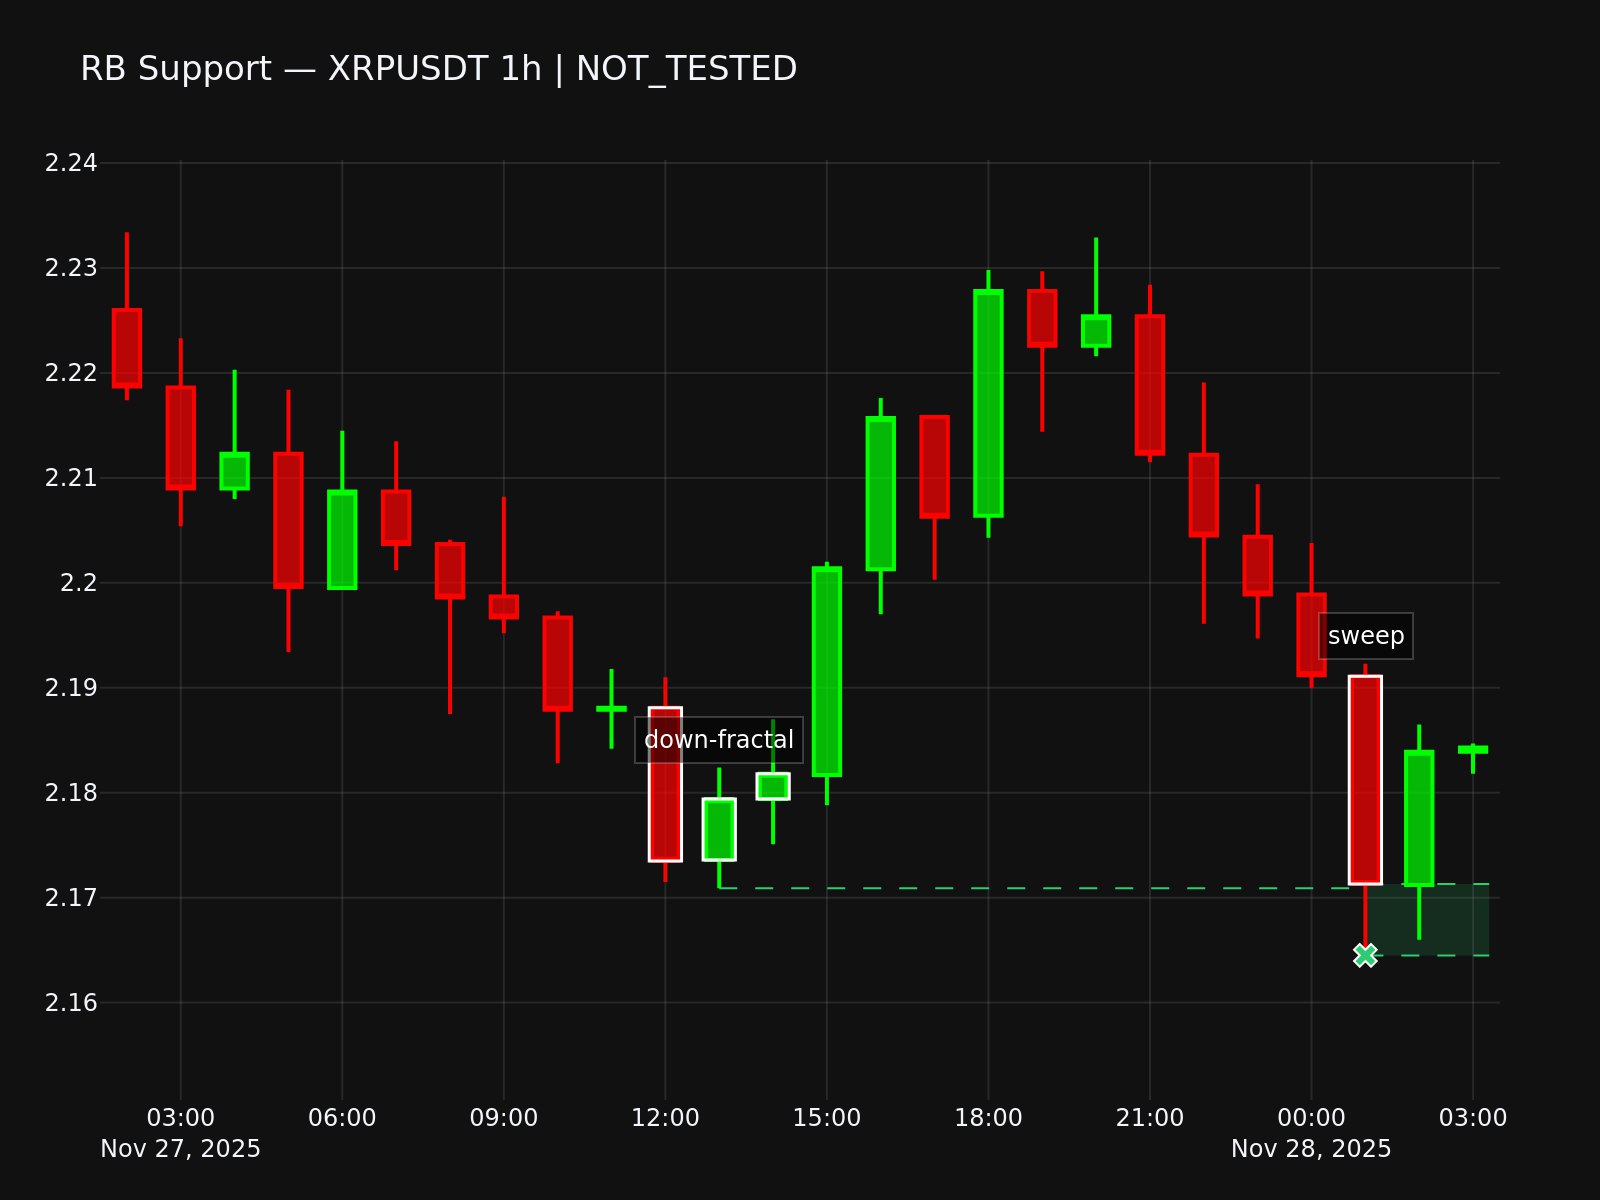
Rejection Blocks (RB)
RB are zones formed by failed breakouts (sweeps) where price wicks beyond a level but closes back inside, signaling rejection.
Formation Sources
- Bullish RB: Price sweeps below an up-fractal or bullish FVG but closes above.
- Bearish RB: Price sweeps above a down-fractal or bearish FVG but closes below.
Sweep Validation
Rejection must be confirmed by the color of adjacent candles (e.g., red candle before green bullish sweep).
Use Case: Spot false breakouts and trade reversals.
Create Custom Triggers
Set up alerts for any combination of trading pair, event type, and timeframe. Receive notifications only when your conditions are met.
How Triggers Work
- Unlimited Creation: No limits on the number of triggers (only pair limits apply per plan).
- Supported Timeframes: 5m, 15m, 30m, 1h, 2h, 4h, 8h, 12h, 1d, 3d, 1w.
- Event Types: Fractal Sweeps, FVG, SnR, RB.
- Validation Option: Enable cross-timeframe validation for higher-quality signals (Pro plan only).
Trigger Lifecycle
- Creation: Select pair, event type, timeframe. Bot scans historical data (last 100 candles) and sends immediate alerts if events are found.
- Monitoring: Bot checks for new events every 10 minutes.
- Notification: Receive Telegram message with event details, chart visualization, timestamp, and status.
Cross-Timeframe Validation (X→X-1)
Validation ensures event signals are backed by liquidity confirmation on a lower timeframe, filtering out low-quality setups.
How Validation Works
Principle: Liquidity zones on the lower timeframe (X-1) must cover the boundaries of the event zone on the higher timeframe (X).
Validation Modes
- Off: Validation is disabled; alerts are sent without validation checks.
- Strict: Alerts are sent only if the event is successfully validated (confirmed); unvalidated events are filtered out.
- All Events: Alerts are sent for all events (validated and unvalidated), and each message explicitly shows the validation status (e.g., "Confirmed" or "Not passed").
User Access
Validation modes are available to users whose subscription plan includes the Validation option.
Interaction
Users can switch validation modes in the bot's Settings menu. The button acts as a sequential toggle cycling through the modes in this order: Off → Strict → All Events → Off.
Choose Your Plan
Start with our Free plan or unlock advanced features with Pro.
Pro plan subscriptions will be available soon. Payment via Stripe/PayPal. Cancel anytime.
Frequently Asked Questions
What markets does the bot support?
Currently, ChartTraceBot tracks Binance Futures markets (USDT pairs).
How often are events checked?
The bot scans for new events every 10 minutes.
Can I disable validation?
Yes, validation is optional. Free users cannot enable it; Pro users can toggle it on/off per trigger.
Do I need API keys?
No, the bot only monitors public market data. No exchange connection required.
How do I cancel my Pro subscription?
Contact support via Telegram or email anytime to cancel.
Earn with ChartTraceBot
Turn your audience into income. Join our Partner Program and earn recurring commissions.
Start Earning in Under 1 Minute
Open the Bot
Go to @ChartTraceBot in Telegram
Create Your Code
Tap "👥 Partners" → "Create Promo Code" → Enter your unique code
Start Earning
Share your code. Get 25% of every subscription for 6 months
Program Benefits
Not one-time — earn on every payment for 6 months
Easier conversions with exclusive savings
Track referrals and earnings directly in the bot
No approval needed — create your code and start immediately
Who Should Join?
Earnings Example
You refer 50 Pro subscribers
Each pays $7.50/month (25% off $10)
Your commission: $1.875/month × 50 = $93.75/month
Over 6 months: $562.50
Minimum payout: €100 • Payouts processed monthly in EUR • Request via "📩 Support" in the bot
Partner FAQ
How do I track my earnings?
Statistics are available in the bot under the Partners menu.
When do I get paid?
Monthly, once you reach the €100 minimum threshold.
Can I promote on multiple platforms?
Yes, use your promo code anywhere — social media, YouTube, Telegram, etc.
Partner Program Terms & Conditions
- Each user can create only one promo code (code cannot be changed or deleted)
- Commission is calculated on net subscription revenue after payment processing fees
- Payouts are processed by a European legal entity (RMX Tec EOOD, Bulgaria)
- Payouts can only be made to jurisdictions where transfers from the EU are legally permitted
- Self-referrals are not allowed — you cannot use your own promo code
- We reserve the right to modify or terminate the program with 30 days notice
- To process payouts, we may need to collect and process recipient identification and banking information in accordance with applicable regulations
- By participating, you agree to these terms